Difference between revisions of "Manifesto"
| (29 intermediate revisions by 2 users not shown) | |||
| Line 1: | Line 1: | ||
| + | |||
'''Working with Data | '''Working with Data | ||
—interactive audiovisual narratives''' | —interactive audiovisual narratives''' | ||
| + | =Introduction= | ||
| − | + | During this 5 weeks period, we will learn about data, how to collect them, and how to work with existing data in an interactive audiovisual context with TouchDesigner. | |
| + | The structure of this lesson will be a combination of both lectures and practical hands-on workshops. | ||
| + | at the end of this 5 weeks period, students are expected to build up an understanding of data and develop skills to work with data in an interactive audiovisual context with the software TouchDesigner. | ||
https://derivative.ca/ | https://derivative.ca/ | ||
| − | |||
| − | + | ==what is data?== | |
| + | |||
| + | Data are units of information, often numeric, that are collected through observation. | ||
| + | |||
| + | |||
| + | ==Ethical and artistic approach towards data-oriented works== | ||
| + | |||
| + | '''1. Data ≠ Information''' | ||
| + | |||
| + | often we need to interpret data as information. | ||
| + | |||
| + | Although the terms "data" and "information" are often used interchangeably, these terms have distinct meanings. | ||
| + | |||
| + | In some popular publications, '''data are sometimes said to be transformed into information when they are viewed in context or in post-analysis.''' | ||
| + | |||
| + | In artistic practices, we often need to read analyses and extract concepts and narratives from cold, and abstract data. | ||
| + | |||
| + | For example: "Alice likes to eat apples." consider as information, and we could gain that information by interpreting a list of Alice's grocery data. | ||
| + | |||
| + | However, the information also could be faulty, if she is buying apples for her friends or to feed animals in the petting zoo every week. | ||
| + | |||
| + | we need to be careful when we work with data because data can be deceptive if we collected it wrong or interpret it wrong. | ||
| + | |||
| − | ''' | + | '''2. Ethical Approach''' |
| − | + | '''a critical approach to evaluating if the existing data set is ethical by asking 4 important questions:''' | |
Where did the data set collected? | Where did the data set collected? | ||
| Line 24: | Line 49: | ||
Is informed consent given when the data set was collected from people? | Is informed consent given when the data set was collected from people? | ||
| − | ''' | + | we can also use the previous example to ask: is it ethical to collect personal grocery data from Alice. did she give her consent? |
| + | |||
| + | ethical data should be collected anonymously without connections to personal information. | ||
| + | |||
| + | |||
| + | |||
| + | '''3. Artistic Approach''' | ||
| + | |||
| + | "Working with data means designing ways to transform the abstract and the uncountable into something that can be seen, | ||
| + | |||
| + | felt, and directly connected to our lives and to our behaviors." | ||
| + | |||
| + | — Giorgia Lupi | ||
| + | |||
| + | ==Example of works== | ||
| + | |||
| + | [[example-data-art]] | ||
| + | |||
| + | ==Basic visual networks in TouchDesigner== | ||
| + | |||
| + | TouchDesigner is a node-based visual programming language for real-time interactive multimedia content. It's been used by artists, programmers, creative coders, and performers to create performances, installations, and fixed media works. | ||
| + | |||
| + | https://derivative.ca/ | ||
| + | |||
| + | ==='''Interface and operators overview'''=== | ||
| + | |||
| + | |||
| + | 1.The network, operators, and timeline | ||
| + | |||
| + | 2.viewing options | ||
| + | |||
| + | 3.viewer active tag | ||
| + | |||
| + | 4.display tag | ||
| + | |||
| + | |||
| + | ==='''Operators!-- the basic building blocks:'''=== | ||
| + | |||
| + | 1. TOP - Texture Operators handle all 2D image operations. | ||
| + | |||
| + | 2. CHOP - Channel Operators are used for motion, audio, animation, and control signals. | ||
| + | |||
| + | 3. SOP - Surface Operators are the native 3D objects of TouchDesigner responsible for 3D points, polygons, and other 3D "primitives" | ||
| + | |||
| + | 4. MAT - Materials are used for applying materials and shaders to the 3D rendering pipeline. | ||
| + | |||
| + | 5. DAT - Data Operators are for ASCII text as plain text, scripts, XML, and tables. | ||
| + | |||
| + | 6. COMP - Components represent 3D objects, panel components, and other various operators. These components can house entire networks of other operators. | ||
| + | |||
| + | |||
| + | ===Simple networks=== | ||
| + | |||
| + | Starting with TOPs imagine they are raw materials and recipes for your visual networks. | ||
| + | later we can link them together and experiment. | ||
| + | |||
| + | |||
| + | |||
| + | let’s first put down the TOPs below into the blank space. | ||
| + | |||
| + | 1. ramp, Noise, movie file in, circle, text, video device in. | ||
| + | |||
| + | 2. lookup, composite | ||
| + | |||
| + | 3. transform, edge, displace | ||
| + | |||
| + | As you can see some of the TOPs give us a red error, let’s because they need at least one input. don’t worry we will deal with it later:-) | ||
| + | |||
| + | ===simple script:=== | ||
| − | + | absTime.seconds | |
| − | + | absTime.seconds*0.2 | |
| − | + | absTime.seconds*2 | |
| + | [[File:AbsTime.seconds.png]] | ||
| − | = | + | ===Export Movie=== |
| − | + | '''1. TOP: moviefileout''' | |
| − | + | [[File:Top-movieFileOut.png]] | |
| − | + | '''2. file→Export Movie''' | |
| − | + | [[File:Fle→Export Movie.png]] | |
| − | + | ===Performance Mode Full Screen=== | |
| − | + | [[File:Introduction to TouchDesigner-39.jpg]] | |
| − | + | ==Work with Tabular data in TouchDesigner== | |
| + | ===Data format=== | ||
| + | data could come in a variety of formats. | ||
| + | And here is a list of data formats we might encounter: | ||
| − | + | '''JSON''' | |
| − | + | JSON (JavaScript Object Notation, is an open standard file format and data interchange format that uses human-readable text to store and transmit data objects consisting of attribute-value pairs and arrays. It is a common data format with a diverse range of functionality in data interchange including communication of web applications with servers. | |
| − | + | and it looks like this: | |
| − | = | + | <syntaxhighlight lang="Javascript" line='line'> |
| − | + | { | |
| + | "Students": [ | ||
| + | |||
| + | { "Name":"Amit Goenka" , | ||
| + | "Major":"Physics" }, | ||
| + | { "Name":"Smita Pallod" , | ||
| + | "Major":"Chemistry" }, | ||
| + | { "Name":"Rajeev Sen" , | ||
| + | "Major":"Mathematics" } | ||
| + | ] | ||
| + | } | ||
| + | </syntaxhighlight> | ||
| − | |||
| − | + | An object starts and ends with '{' and '}'. Between them, a number of string value pairs can reside. String and value is separated by a ':' and if there are more than one string value pairs, they are separated by ','. | |
| − | + | In JSON, objects can nest arrays (starts and ends with '[' and ']') within it. The following example shows that. | |
| − | |||
| − | + | '''XML''' | |
| − | + | Extensible Markup Language (XML) is a markup language that defines a set of rules for encoding documents in a format that is both human-readable and machine-readable. | |
| − | == | + | and it looks like this: |
| + | <syntaxhighlight lang="XML" line='line'> | ||
| + | <root> | ||
| + | <child> | ||
| + | <subchild>.....</subchild> | ||
| + | </child> | ||
| + | </root> | ||
| + | </syntaxhighlight> | ||
| + | or | ||
| + | <syntaxhighlight lang="XML" line='line'> | ||
| + | <?xml version="1.0" encoding="UTF-8"?> | ||
| + | <bookstore> | ||
| + | <book category="cooking"> | ||
| + | <title lang="en">Everyday Italian</title> | ||
| + | <author>Giada De Laurentiis</author> | ||
| + | <year>2005</year> | ||
| + | <price>30.00</price> | ||
| + | </book> | ||
| + | <book category="children"> | ||
| + | <title lang="en">Harry Potter</title> | ||
| + | <author>J K. Rowling</author> | ||
| + | <year>2005</year> | ||
| + | <price>29.99</price> | ||
| + | </book> | ||
| + | <book category="web"> | ||
| + | <title lang="en">Learning XML</title> | ||
| + | <author>Erik T. Ray</author> | ||
| + | <year>2003</year> | ||
| + | <price>39.95</price> | ||
| + | </book> | ||
| + | </bookstore> | ||
| + | </syntaxhighlight> | ||
| + | |||
| + | '''CSV''' | ||
A CSV file typically stores tabular data (numbers and text) in plain text. | A CSV file typically stores tabular data (numbers and text) in plain text. | ||
CSV stands for Comma-separated values. | CSV stands for Comma-separated values. | ||
| + | it looks like this: | ||
| + | |||
| + | Los Angeles,34°03′N,118°15′W | ||
| + | |||
| + | New York City,40°42′46″N,74°00′21″W | ||
| − | + | Paris,48°51′24″N,2°21′03″E | |
| − | |||
| − | + | '''TXT''' | |
| + | Text file | ||
| − | how to | + | ===work with tabular data: how to read data and save data in TD=== |
DAT table operator | DAT table operator | ||
| + | |||
| + | ===how to link data into your visual network=== | ||
| + | |||
| + | ===homework: data portrait=== | ||
| + | |||
| + | ==Advance visual networks in TouchDesigner== | ||
| + | |||
| + | ===feedback networks=== | ||
| + | |||
| + | what is feedback? | ||
| + | |||
| + | ===feedback networks recipes=== | ||
| + | |||
==Work with API in TouchDesigner== | ==Work with API in TouchDesigner== | ||
| + | |||
| + | '''View JSON in Chrome''' | ||
| + | |||
| + | JSON Formatter | ||
| + | https://chrome.google.com/webstore/detail/json-formatter/bcjindcccaagfpapjjmafapmmgkkhgoa?hl=en | ||
| + | |||
| + | and go to window-> extension enable the plugin | ||
| + | |||
Register account API keys or generate tokens | Register account API keys or generate tokens | ||
| − | A list of open APIs: | + | =='''A list of open APIs:'''== |
| + | |||
| + | A list of free APIs: | ||
| + | |||
| + | '''Buienradar API:''' | ||
| + | |||
| + | https://pypi.org/project/buienradar/ | ||
| + | |||
| + | https://data.buienradar.nl/2.0/feed/json | ||
| + | |||
| + | https://data.buienradar.nl/1.0/feed/xml | ||
| + | |||
| + | '''open weather map:''' | ||
| + | |||
| + | https://openweathermap.org/api | ||
| + | |||
| + | |||
| + | '''Face generator:''' | ||
| + | |||
| + | https://thispersondoesnotexist.com/ | ||
| + | |||
| + | '''Real-time covid data:''' | ||
| + | https://raw.githubusercontent.com/owid/covid-19-data/master/public/data/latest/owid-covid-latest.json | ||
| + | |||
| + | '''Evil Insult Generator:''' | ||
| + | |||
| + | https://evilinsult.com/api/#generate-insult-get | ||
| + | |||
| + | |||
| + | '''quotes in JSON:''' | ||
| + | |||
| + | https://type.fit/api/quotes | ||
| + | |||
| + | '''NASA API:''' | ||
| + | |||
| + | https://api.nasa.gov/ | ||
| + | |||
| + | Neo - Lookup: | ||
| + | |||
| + | Lookup a specific Asteroid based on its NASA JPL small body (SPK-ID) ID GET https://api.nasa.gov/neo/rest/v1/neo/ | ||
| + | |||
| + | |||
| + | |||
| + | NASA APOD | ||
| + | |||
| + | https://apodapi.herokuapp.com/ | ||
| + | |||
| + | |||
| + | Download CSV: | ||
| + | |||
| + | '''open data NL:''' | ||
| + | |||
| + | https://opendata.cbs.nl/statline/#/CBS/en/navigatieScherm/thema?themaNr=5500 | ||
| + | |||
| + | https://opendata.cbs.nl/statline/#/CBS/en/dataset/84672ENG/table?ts=1666166611934 | ||
| + | |||
| + | [[Category:TouchDesigner]] | ||
Latest revision as of 10:21, 14 March 2023
Working with Data
—interactive audiovisual narratives
Introduction
During this 5 weeks period, we will learn about data, how to collect them, and how to work with existing data in an interactive audiovisual context with TouchDesigner. The structure of this lesson will be a combination of both lectures and practical hands-on workshops. at the end of this 5 weeks period, students are expected to build up an understanding of data and develop skills to work with data in an interactive audiovisual context with the software TouchDesigner.
what is data?
Data are units of information, often numeric, that are collected through observation.
Ethical and artistic approach towards data-oriented works
1. Data ≠ Information
often we need to interpret data as information.
Although the terms "data" and "information" are often used interchangeably, these terms have distinct meanings.
In some popular publications, data are sometimes said to be transformed into information when they are viewed in context or in post-analysis.
In artistic practices, we often need to read analyses and extract concepts and narratives from cold, and abstract data.
For example: "Alice likes to eat apples." consider as information, and we could gain that information by interpreting a list of Alice's grocery data.
However, the information also could be faulty, if she is buying apples for her friends or to feed animals in the petting zoo every week.
we need to be careful when we work with data because data can be deceptive if we collected it wrong or interpret it wrong.
2. Ethical Approach
a critical approach to evaluating if the existing data set is ethical by asking 4 important questions:
Where did the data set collected?
Who collected the data?
And is the purpose of the collected data?
Is informed consent given when the data set was collected from people?
we can also use the previous example to ask: is it ethical to collect personal grocery data from Alice. did she give her consent?
ethical data should be collected anonymously without connections to personal information.
3. Artistic Approach
"Working with data means designing ways to transform the abstract and the uncountable into something that can be seen,
felt, and directly connected to our lives and to our behaviors."
— Giorgia Lupi
Example of works
Basic visual networks in TouchDesigner
TouchDesigner is a node-based visual programming language for real-time interactive multimedia content. It's been used by artists, programmers, creative coders, and performers to create performances, installations, and fixed media works.
Interface and operators overview
1.The network, operators, and timeline
2.viewing options
3.viewer active tag
4.display tag
Operators!-- the basic building blocks:
1. TOP - Texture Operators handle all 2D image operations.
2. CHOP - Channel Operators are used for motion, audio, animation, and control signals.
3. SOP - Surface Operators are the native 3D objects of TouchDesigner responsible for 3D points, polygons, and other 3D "primitives"
4. MAT - Materials are used for applying materials and shaders to the 3D rendering pipeline.
5. DAT - Data Operators are for ASCII text as plain text, scripts, XML, and tables.
6. COMP - Components represent 3D objects, panel components, and other various operators. These components can house entire networks of other operators.
Simple networks
Starting with TOPs imagine they are raw materials and recipes for your visual networks. later we can link them together and experiment.
let’s first put down the TOPs below into the blank space.
1. ramp, Noise, movie file in, circle, text, video device in.
2. lookup, composite
3. transform, edge, displace
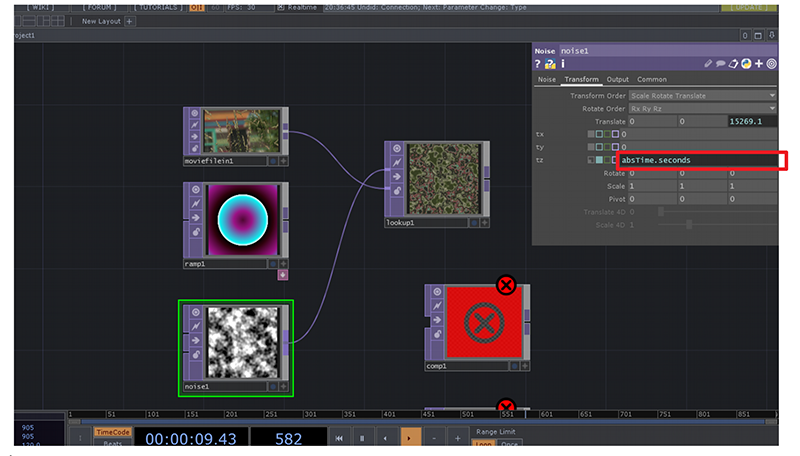
As you can see some of the TOPs give us a red error, let’s because they need at least one input. don’t worry we will deal with it later:-)
simple script:
absTime.seconds
absTime.seconds*0.2
absTime.seconds*2
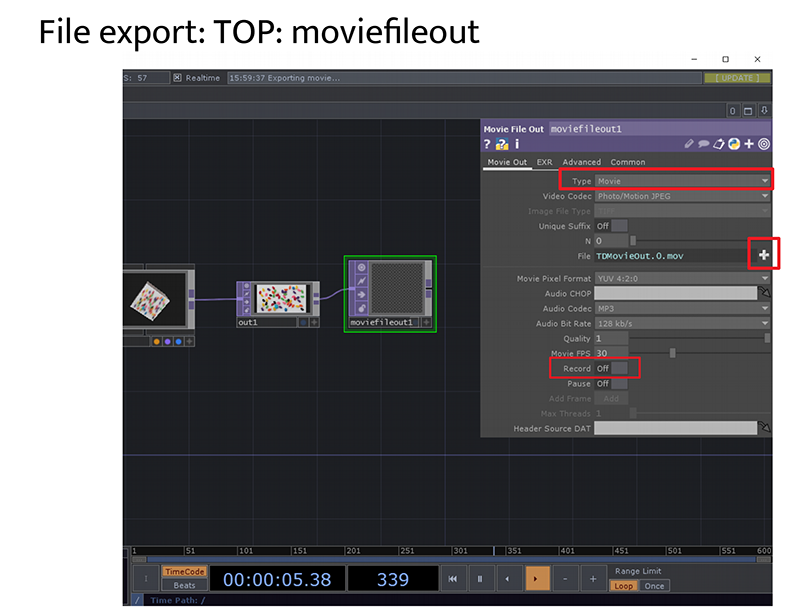
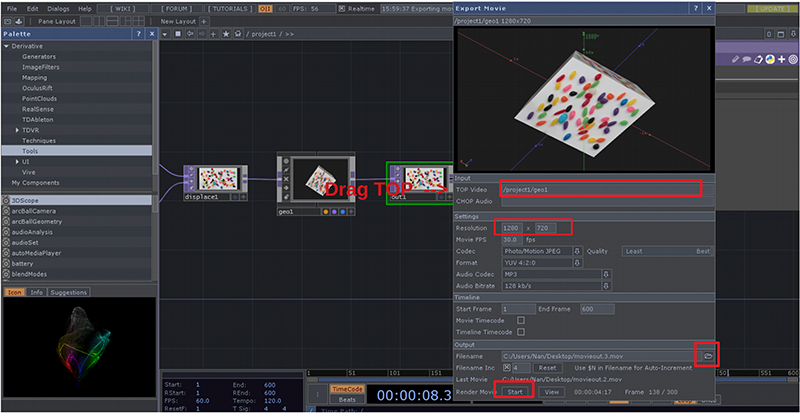
Export Movie
1. TOP: moviefileout
2. file→Export Movie
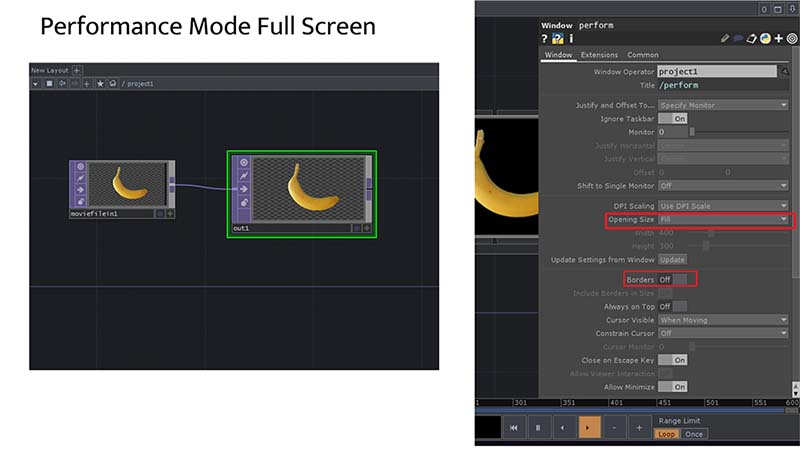
Performance Mode Full Screen
Work with Tabular data in TouchDesigner
Data format
data could come in a variety of formats. And here is a list of data formats we might encounter:
JSON
JSON (JavaScript Object Notation, is an open standard file format and data interchange format that uses human-readable text to store and transmit data objects consisting of attribute-value pairs and arrays. It is a common data format with a diverse range of functionality in data interchange including communication of web applications with servers.
and it looks like this:
 1 {
 2  "Students": [
 3
 4			  { "Name":"Amit Goenka" ,
 5  "Major":"Physics" },
 6			  { "Name":"Smita Pallod" ,
 7  "Major":"Chemistry" },
 8			  { "Name":"Rajeev Sen" ,
 9  "Major":"Mathematics" }
10			  ]
11			  }
An object starts and ends with '{' and '}'. Between them, a number of string value pairs can reside. String and value is separated by a ':' and if there are more than one string value pairs, they are separated by ','.
In JSON, objects can nest arrays (starts and ends with '[' and ']') within it. The following example shows that.
XML
Extensible Markup Language (XML) is a markup language that defines a set of rules for encoding documents in a format that is both human-readable and machine-readable.
and it looks like this:
1<root>
2  <child>
3    <subchild>.....</subchild>
4  </child>
5</root>
or
 1<?xml version="1.0" encoding="UTF-8"?>
 2<bookstore>
 3  <book category="cooking">
 4    <title lang="en">Everyday Italian</title>
 5    <author>Giada De Laurentiis</author>
 6    <year>2005</year>
 7    <price>30.00</price>
 8  </book>
 9  <book category="children">
10    <title lang="en">Harry Potter</title>
11    <author>J K. Rowling</author>
12    <year>2005</year>
13    <price>29.99</price>
14  </book>
15  <book category="web">
16    <title lang="en">Learning XML</title>
17    <author>Erik T. Ray</author>
18    <year>2003</year>
19    <price>39.95</price>
20  </book>
21</bookstore>
CSV A CSV file typically stores tabular data (numbers and text) in plain text. CSV stands for Comma-separated values.
it looks like this:
Los Angeles,34°03′N,118°15′W
New York City,40°42′46″N,74°00′21″W
Paris,48°51′24″N,2°21′03″E
TXT Text file
work with tabular data: how to read data and save data in TD
DAT table operator
how to link data into your visual network
homework: data portrait
Advance visual networks in TouchDesigner
feedback networks
what is feedback?
feedback networks recipes
Work with API in TouchDesigner
View JSON in Chrome
JSON Formatter https://chrome.google.com/webstore/detail/json-formatter/bcjindcccaagfpapjjmafapmmgkkhgoa?hl=en
and go to window-> extension enable the plugin
Register account API keys or generate tokens
A list of open APIs:
A list of free APIs:
Buienradar API:
https://pypi.org/project/buienradar/
https://data.buienradar.nl/2.0/feed/json
https://data.buienradar.nl/1.0/feed/xml
open weather map:
https://openweathermap.org/api
Face generator:
https://thispersondoesnotexist.com/
Real-time covid data: https://raw.githubusercontent.com/owid/covid-19-data/master/public/data/latest/owid-covid-latest.json
Evil Insult Generator:
https://evilinsult.com/api/#generate-insult-get
quotes in JSON:
NASA API:
Neo - Lookup:
Lookup a specific Asteroid based on its NASA JPL small body (SPK-ID) ID GET https://api.nasa.gov/neo/rest/v1/neo/
NASA APOD
https://apodapi.herokuapp.com/
Download CSV:
open data NL:
https://opendata.cbs.nl/statline/#/CBS/en/navigatieScherm/thema?themaNr=5500
https://opendata.cbs.nl/statline/#/CBS/en/dataset/84672ENG/table?ts=1666166611934


